and from this afternoon ...
Showing posts with label Periodic Functions. Show all posts
Showing posts with label Periodic Functions. Show all posts
Monday, June 2, 2008
Friday, May 30, 2008
Tuesday, May 27, 2008
Monday, May 26, 2008
Periodic Functions
In the first part of class this morning we went over what we learned last class (Friday). After that we finished up about the role of Parameter B & the role of Parameter C. The pictures below are pretty straight forward on how it works & how to get it.


Okay, the picture above...I bet your wondering what does the 2 (or any #) in front of the X does!? It helps you find the period....Remember it's not the period it just helps you find it!

After that we went over are homework. Now, I give honors to the next scribe....and they are........ICKIE!!!!!
Friday, May 23, 2008
Using sine for patterns
Using SinReg for to figure out patterns is a useful feature. First of all, you need to enter the data into a statplot. Let us say for instance we are calculating the time we have of sunshine each month.
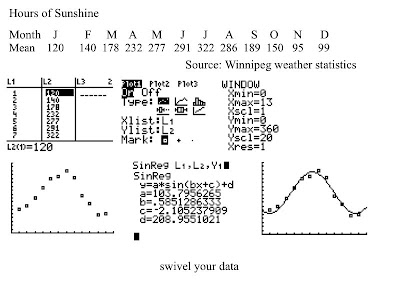
The order of the data that we will get starting after the data given of sunshine is, step 1. the list, step 2.the graph settings, step 3. the V-Win option, step 4. the graph with no line, step 5. the the SinReg list, step 6. the graph with the line.
Step 1.In order to make the list with the sunshine data, you enter the months of the year in list number 1 (ex. January = 1, Febuary = 2, March = 3, etc.). Next, you enter the data for each month into the second list (ex. January = 120, Febuary = 140, March = 178, etc). Once you are finished putting in the list data for each month, you will adjust your graph settings in step 2.
Step 2. you want to set up the data to display a scatter plot. The x and y would be list one and list two (in that order). Any data point can be used for your preferences (Mr.K likes to use the squares).
Step 3. in order to get a good view of the data, you want to set up your V-Win so it goes beyond the data point of of the highest and lowest x and y values. Do not set it up too far or else the data will be squashed.
Step 4. Press the graph button to acheive this data ( must do step 1 though 3 first).
Step 5. go to the calc menu, press reg, and scale down until you reach SinReg. you press it and you should get this formula (refer to the picture).
Step 6. You copy Sinreg to the graph menu. After you get to the graph screen, you must put in beside SinReg L1, L2, Y1. Press graph to get this step. The pattern is likely to continue the next year so now you have a approx. pattern (will never get line exactly with dot). SinReg is useful when getting patterns in a series of data within a certain time period.
Wednesday, May 21, 2008
Periodic Functions
Hey guys this is alvin again with another scribe post!


So what is "Periodic" (Period) really??
--Anything that repeats after a certain/fixed length of time.
Examples
-High tide vs. Low tide
-High tide vs. Low tide
-Heart beat
-Clocks
-Rotation of earth on sun or the Moon on earth
-Rotation of earth on sun or the Moon on earth
...etc.

The inner layer are in degreese while the outer fractions with the Pi are radians.
These sets are the most basic angles.
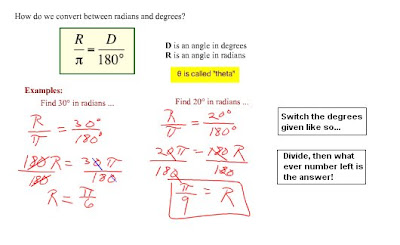
The ratio!

Dealing with negative numbers are a bit different, but not at all difficult. The negative numbers move clockwise while the positive numbers go counter-clockwise (Degrees). But as show on the diagram below, there are 2 ways of getting into the end point. Be careful on what the question is asking or you might end up using a wrong positive/negative number.
Over all, the class today was pretty blunt and covered alot of the stuff. So far its piece-easy, all you really need is to know the ratio, after that, you have a number of options on how to get your answer.
[For any questions, concerns, additions and corrections please leave a comment]
The next scribe is Rennie...?
Subscribe to:
Posts (Atom)

