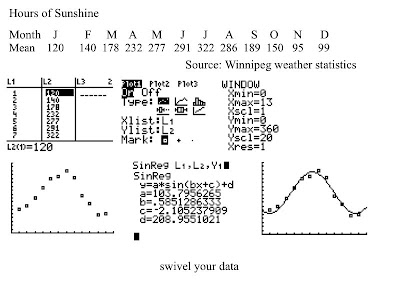
The order of the data that we will get starting after the data given of sunshine is, step 1. the list, step 2.the graph settings, step 3. the V-Win option, step 4. the graph with no line, step 5. the the SinReg list, step 6. the graph with the line.
Step 1.In order to make the list with the sunshine data, you enter the months of the year in list number 1 (ex. January = 1, Febuary = 2, March = 3, etc.). Next, you enter the data for each month into the second list (ex. January = 120, Febuary = 140, March = 178, etc). Once you are finished putting in the list data for each month, you will adjust your graph settings in step 2.
Step 2. you want to set up the data to display a scatter plot. The x and y would be list one and list two (in that order). Any data point can be used for your preferences (Mr.K likes to use the squares).
Step 3. in order to get a good view of the data, you want to set up your V-Win so it goes beyond the data point of of the highest and lowest x and y values. Do not set it up too far or else the data will be squashed.
Step 4. Press the graph button to acheive this data ( must do step 1 though 3 first).
Step 5. go to the calc menu, press reg, and scale down until you reach SinReg. you press it and you should get this formula (refer to the picture).
Step 6. You copy Sinreg to the graph menu. After you get to the graph screen, you must put in beside SinReg L1, L2, Y1. Press graph to get this step. The pattern is likely to continue the next year so now you have a approx. pattern (will never get line exactly with dot). SinReg is useful when getting patterns in a series of data within a certain time period.

No comments:
Post a Comment